
Exploring the Genetic Architecture of Type 2 Diabetes in the Korean Population: Joint Effect of Common and Rare Coding Variants
Abstract
Despite the identification of numerous common variants associated with type 2 diabetes (T2D), a substantial portion of its heritability remains unexplained. This study explored the complex genetic architecture of T2D in the Korean population by integrating the effects of common and rare coding variants, which have traditionally been analyzed in isolation.
We conducted a large-scale genomic analysis using exome-chip data from 11,599 individuals within the Korean Genome and Epidemiology Study (KoGES). To maximize statistical power, we employed the Sequence Kernel Association Test for Rare and Common variants (SKAT-RC), a unified framework that captures the joint contribution of variants across the entire frequency spectrum. The performance of SKAT-RC was systematically compared with single-variant GWAS and conventional gene-based rare-variant tests (Burden, SKAT, and SKAT-O).
Beyond replicating established susceptibility loci (e.g., CDKAL1 and KCNQ1), SKAT-RC identified novel genome-wide significant associations in HMGA1, MARCHF3, and CHEK2. Notably, these signals were largely undetected by frequency-specific analyses, suggesting that T2D risk in these loci is driven by a synergistic interplay between common regulatory and rare functional variants.
Our findings demonstrate that an integrated allelic-spectrum approach significantly recovers "missing heritability" that standard methodologies overlook. This study provides a refined genetic map of T2D in East Asians and underscores the need for integrated genomic models to advance risk prediction and personalized preventive strategies in public health.
Keywords:
Type 2 Diabetes, SKAT-RC, KoGES, Exome Chip, HMGA1, MARCHF3, CHEK2Introduction
Type 2 diabetes (T2D) manifests as a chronic metabolic disruption characterized by persistent hyperglycemia, primarily driven by the interplay between systemic insulin resistance and progressive pancreatic β-cell dysfunction [1]. The global epidemiological landscape of T2D has shifted dramatically, with prevalence nearly doubling from 4.7% in 1980 to 8.5% in 2014 [2]. This escalating public health challenge is notably evident in South Korea, where the prevalence among adults aged 30 and older has reached 12.4% as of 2021, imposing a significant burden on the national healthcare system [3]. Beyond its metabolic impact, T2D acts as a precursor to debilitating microvascular and macrovascular complications, including retinopathy, nephropathy, and cardiovascular disease [4]. Given its significant heritability (estimated at 25–55% in East Asian populations), deciphering the underlying genetic architecture is a prerequisite for advancing precision diagnostics and targeted therapeutic strategies [5].
The foundational era of genome-wide association studies (GWAS) has successfully mapped hundreds of common loci (minor allele frequency [MAF] > 5%) associated with T2D risk [6]. Robust signals in genes such as TCF7L2, KCNQ1, and CDKAL1 have been consistently replicated across diverse ethnic groups, including East Asian populations [7, 8]. Nevertheless, these common variants account for only a modest fraction (~10%) of the total phenotypic variance, leaving a substantial portion of "missing heritability" unresolved [9]. This gap has shifted the focus toward the "rare variant hypothesis," which suggests that low-frequency (MAF 1–5%) and rare variants (MAF < 1%) may harbor larger effect sizes and provide more direct insights into the functional mechanisms of disease susceptibility [10].
To interrogate these rare signals, various gene-based rare-variant association tests (RVATs), such as the Burden test, SKAT, and its optimal version (SKAT-O), have been developed [11, 12]. While transformative, these conventional RVATs are often hindered by an inherent analytical trade-off: they typically prioritize rare variants while down-weighting or excluding the contributions of common variants within the same locus [13, 14]. Emerging genomic evidence indicates that genetic risk within a single gene is frequently distributed across a broad allelic spectrum, including both common and rare variants [15]. Consequently, segregating these variants into discrete analysis streams can significantly erode statistical power, particularly in regions where diverse frequency classes act in synergy [13].
The paradigm of integrating common and rare variants through joint testing frameworks, such as the hierarchical modeling approach proposed by Cardin et al. [16], has emerged as a powerful strategy to overcome the limitations of traditional frequency-stratified analyses. Expanding on this conceptual foundation, the Sequence Kernel Association Test for Rare and Common variants (SKAT-RC) addresses this limitation by using a unified, flexible, kernel-based architecture that integrates signals across the frequency spectrum [13]. This integrated approach is ideally suited for exome-chip data, which are enriched for both functional rare coding variants and established common regulatory variants [17]. Despite its robustness, the application of SKAT-RC in East Asian populations remains nascent. Considering the distinct linkage disequilibrium (LD) patterns and unique genetic backgrounds of East Asians, applying such integrated models to Korean cohorts may uncover novel pathogenic insights that have eluded traditional analysis pipelines.
In this study, we employed the SKAT-RC framework to investigate the genetic drivers of T2D within a large-scale South Korean population. We leveraged a comprehensive dataset of 11,599 individuals by harmonizing three major cohorts from the Korean Genome and Epidemiology Study (KoGES): Ansan-Ansung (KARE), Health Examinees (HEXA), and Cardiovascular Disease Association (CAVAS) [18]. Our study provides a comparative evaluation of SKAT-RC against standard single-variant logistic regression and conventional RVATs. By moving beyond frequency-based stratification, we aim to validate the effectiveness of joint allelic modeling and identify novel candidate genes to refine the precision medicine landscape for T2D in South Korea.
Methods
Study Population and Cohort Integration
The study population was derived from the Korean Genome and Epidemiology Study (KoGES), a comprehensive, longitudinal project overseen by the Korea National Institute of Health (KNIH) [18]. To maximize statistical power for gene-based association mapping, we harmonized individual-level data from three distinct sub-cohorts: the Ansan-Ansung Study (KARE; community-based), the Health Examinees Study (HEXA; urban-based), and the Cardiovascular Disease Association Study (CAVAS; rural-based). This multi-center integration effectively captures the diverse demographic and environmental exposures of the South Korean population, thereby enhancing the generalizability of our findings.
A rigorous quality control (QC) process was implemented for participant selection to ensure data integrity and completeness across all adjusted covariates. From the initial KoGES cohort sample (N = 11,599), 93 individuals were sequentially excluded for incomplete clinical phenotypic data. Specifically, participants were removed due to missing information for BMI (n = 37), alcohol intake (n = 26), smoking status (n = 8), systolic or diastolic blood pressure (SBP/DBP, n = 5), physical activity (n = 11), and LDL cholesterol levels (n = 6). Following these sequential phenotypic exclusions, a final analytical dataset consisting of 11,506 participants was established for downstream genetic association analyses (Table 1). The study was conducted in accordance with the Declaration of Helsinki and received formal approval from the Institutional Review Board (IRB) of Hanyang University (IRB No: HYUIRB-202606-004). Prior to cohort enrollment, written informed consent was obtained from all participants.

Sequential sample quality control and exclusion flowchart based on clinical phenotypic data
Covariates and Clinical Assessment
To mitigate potential confounding factors in the genetic association models, we incorporated a comprehensive set of demographics, lifestyle, anthropometric, and biochemical covariates. Demographic and lifestyle data—including age, sex, smoking status, alcohol consumption, and physical activity—were obtained through standardized questionnaires and interviewer-assisted surveys. Smoking status and alcohol intake were categorized into three distinct groups: never, past, and current users. Physical activity was binary-coded as regular vigorous exercise (yes/no).
Anthropometric parameters included height, weight, and blood pressure. Body mass index (BMI) was calculated as weight in kilograms divided by the square of height in meters (kg/m2). Systolic and diastolic blood pressures (SBP and DBP) were recorded using a mercury sphygmomanometer; the mean of three consecutive readings was used for the KARE cohort, while single measurements were utilized for the HEXA and CAVAS cohorts according to their respective protocols.
Biochemical profiles were assessed from peripheral blood samples collected after at least 8 hours of overnight fasting. Measured parameters included fasting plasma glucose (FPG), glycosylated hemoglobin (HbA1c), total cholesterol, high-density lipoprotein (HDL) cholesterol, and triglycerides. Low-density lipoprotein (LDL) cholesterol levels were derived using the Friedewald equation: LDL = Total Cholesterol - HDL - (Triglycerides / 5) [19]. Furthermore, to account for regional variations and potential population stratification, the study area was adjusted as a categorical covariate, subdivided into Ansan (KARE), Ansung (KARE), urban (HEXA), and rural (CAVAS) regions.
Phenotype Definition for Type 2 Diabetes
The clinical classification of glycemic status was established in accordance with the American Diabetes Association (ADA) diagnostic guidelines [20]. Participants were categorized as T2D cases if they fulfilled at least one of the following validated criteria: (1) fasting plasma glucose (FPG) level ≥ 126 mg/dL, (2) HbA1c ≥ 6.5%, (3) a documented clinical history of T2D diagnosis, or (4) ongoing administration of insulin or oral antidiabetic pharmacotherapy.
To ensure phenotypic contrast and minimize misclassification bias, the control group was restricted to individuals with no history of diabetes, FPG < 100 mg/dL, and HbA1c < 5.7%. Crucially, we excluded participants within the prediabetic range (100 ≤ FPG < 126 mg/dL or 5.7 ≤ HbA1c < 6.5%) and those with incomplete glycemic records. This rigorous stratification was employed to prevent phenotypic ambiguity and enhance statistical power to detect genuine genetic associations.
Genotyping, Quality Control, and Functional Annotation
Genome-wide genotyping was performed using the Illumina HumanExome BeadChip v1.1 (Illumina Inc., San Diego, CA, USA), which contains probes for 242,900 single-nucleotide polymorphisms (SNPs) selected from extensive exome and whole-genome sequencing data. Detailed genotyping platforms, array designs, and quality control processes for this dataset have been described comprehensively in a previous study [21].
Genotype quality control (QC) was conducted using PLINK (version 1.9) [22]. To ensure the integrity of the genetic data, we implemented stringent variant-level filtering criteria. Specifically, markers were excluded if they met any of the following conditions: (1) a genotype call rate < 95%, (2) a significant deviation from Hardy–Weinberg Equilibrium (HWE) at P < 1 × 10⁻⁶, or (3) a minor allele count (MAC) < 5.
Post-QC variants were annotated for function using ANNOVAR, using the NCBI human genome assembly (hg19) as the reference. For downstream gene-based association analyses, we prioritized high-qualityvariants located in exonic and splicing regions, as these are more likely to exert direct functional effects on T2D phenotype.
Statistical Analysis
To control for potential population stratification and cryptic relatedness induced by the integration of three distinct cohorts, we performed Principal Component Analysis (PCA) using a pruned set of common variants. The first ten principal components (PC1–PC10) were incorporated as continuous covariates in all association models. Additional adjustments were made for age, sex, BMI, smoking status, alcohol consumption, and physical activity to minimize residual confounding.
For common variants, defined by a Minor Allele Frequency (MAF) > 0.01, association testing was conducted via logistic regression under an additive genetic model. These analyses were performed using PLINK (version 1.9), and the results served as a baseline for comparing the efficiency of subsequent gene-based integrated tests.
Association testing for rare variants (MAF ≤ 0.01) was aggregated at the gene level using the R package ‘SKAT’ [11]. We utilized three conventional RVAT frameworks to compare their performance:
- • Burden Test: Assumes all rare variants in a genomic region have the same direction and magnitude of effect by collapsing them into a single genetic score.
- • Sequence Kernel Association Test (SKAT): A variance-component test that aggregates variant-level score statistics via a kernel matrix, allowing for heterogeneous effect directions and magnitudes [11].
- • SKAT-O: An optimal unified test that adaptively combines Burden and SKAT statistics to maximize statistical power across varying genetic architectures [12].
To evaluate the joint contribution of common and rare variants, we employed the Sequence Kernel Association Test for Rare and Common variants (SKAT-RC) framework [13]. Unlike traditional methods that dichotomize variants, SKAT-RC constructs dual kernels to simultaneously model rare and common variation within a single locus. To optimize the detection of functional signals, we applied a Beta(1, 25) weighting scheme for rare variants (MAF ≤ 0.01) to prioritize lower-frequency alleles, and a Beta(0.5, 0.5) scheme for common variants (MAF > 0.01) to maintain stable power for common regulatory signals. This adaptive framework accounts for the distinct evolutionary pressures and effect sizes associated with different frequency classes, thereby enhancing overall detection power.
The gene-based integrated tests were executed using the ‘SKAT_CommonRare.SSD.ALL’ function within the ‘SKAT’ package in R. The exact implementation framework and parameter arguments utilized for computing the four complementary testing modalities (Burden-C, Burden-A, SKAT-C, and SKAT-A) were structured as follows:
- (1) SKAT-C (Combined joint variance-component test)
SKAT_CommonRare.SSD.All(merged.INFO, obj, method = 'C', CommonRare_Cutoff = 0.01) - (2) Burden-C (Combined joint burden test; r.corr set to 1 for maximum collapsing)
SKAT_CommonRare.SSD.All(merged.INFO, obj, method = 'C', r.corr.common = 1, r.corr.rare = 1, CommonRare_Cutoff = 0.01) - (3) SKAT-A (Adaptive joint test allowing data-dependent weights)
SKAT_CommonRare.SSD.All(merged.INFO, obj, method = 'A', CommonRare_Cutoff = 0.01) - (4) Burden-A (Adaptive joint burden test; r.corr set to 1 for maximum collapsing)
SKAT_CommonRare.SSD.All(merged.INFO, obj, method = 'A', r.corr.common = 1, r.corr.rare = 1, CommonRare_Cutoff = 0.01)
To account for the burden of multiple comparisons across the exome, significance thresholds were strictly defined. We applied the Bonferroni correction to control the family-wise error rate (FWER) and the False Discovery Rate (FDR) using the Benjamini-Hochberg procedure for exploratory discovery. Genome-wide significance for gene-based tests was established at P < 2.5 × 10⁻⁶ (adjusted for approximately 20,000 human genes) or at P < 0.05/Ntested for the specific exome-chip content analyzed. Specifically, multiple testing was rigorously controlled using the Benjamini–Hochberg procedure, with strict statistical significance for primary hallmark loci defined at an FDR-adjusted q-value < 0.05.
Results
Baseline Characteristics of the Study Population
The baseline characteristics of the 11,506 participants (1,577 cases and 9,929 controls) are summarized in Table 2. The mean age of the T2D case group was significantly higher than that of the control group (60.71 ± SD vs. 57.65 ± SD years; P < 0.001). Consistent with the known pathophysiology of T2D, the case group exhibited a higher proportion of males and significantly elevated anthropometric profiles, including BMI, waist circumference, and both SBP and DBP, compared to the controls.
Demographic and clinical characteristics of the study participants by type 2 diabetes status
Biochemical assessments further highlighted the metabolic disparity between the two groups. FPG, HbA1c, triglyceride, and LDL levels were markedly higher in T2D cases, whereas HDL cholesterol levels were significantly lower. These observed phenotypic distributions align with established clinical profiles of T2D within the Korean population and confirm the phenotypic integrity of the study cohorts for subsequent genetic association analyses.
Single-Variant Association Analysis
To establish a baseline for genetic associations, we first performed a single-variant logistic regression analysis focusing on common variants (MAF ≥ 0.01). The genome-wide distribution of these association signals is visualized in the Manhattan plot (Figure 1A). The genomic inflation factor was calculated as λ = 1.029, indicating that population stratification and systematic biases were effectively controlled within our integrated cohort (Figure 1B).
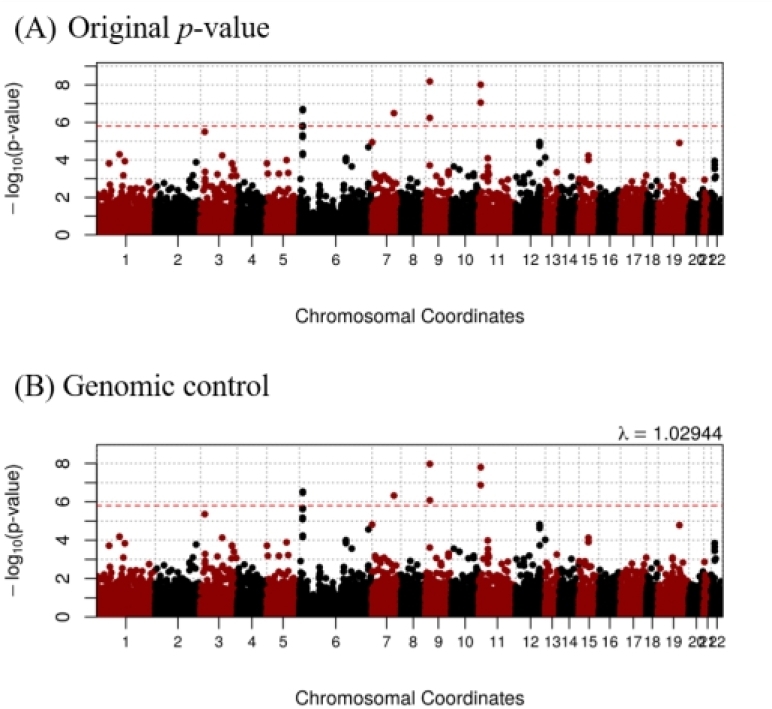
Manhattan plots for single-variant association analysis of type 2 diabetes. The plots represent the genome-wide distribution of association signals across 22 autosomes using the KoGES exome-chip data. The x-axis indicates chromosomal positions, and the y-axis represents -log10(P-value). The horizontal dashed red line denotes the Bonferroni-corrected significance threshold (P < 1.586 × 10⁻⁶). (A) Manhattan plot showing unadjusted P-values. (B) Manhattan plot after applying genomic control, with an inflation factor of λ = 1.029.
Among the tested markers, two common variants exceeded the conventional genome-wide significance threshold (P < 5 × 10⁻⁸), while nine variants surpassed the more stringent Bonferroni-corrected threshold (P < 1.586 × 10⁻⁶). Furthermore, 20 SNPs remained significant after applying the FDR correction (Table S1). We successfully replicated several well-established T2D susceptibility loci, including TCF7L2 (rs7903146), KCNQ1, and CDKAL1. The robust replication of these hallmark signals validates the high quality of our genotyping data and the reliability of our analytical pipeline.
Despite these findings, the single-variant framework exhibited limited sensitivity in detecting associations within gene regions characterized by complex allelic architectures or a high density of rare functional variants. This underscores a critical limitation of traditional GWAS approaches: their relative inability to capture risk signals driven by the lower end of the allele frequency spectrum, thereby necessitating more integrated gene-based methodologies.
Rare Variant Association Analysis
To evaluate the contribution of rare coding variants (MAF ≤ 0.01), we applied three conventional gene-based association tests: Burden, SKAT, and SKAT-O. Under the stringent Bonferroni-corrected exome-wide significance threshold (P < 5.5 × 10⁻⁶), no genes reached statistical significance across any of the three methodologies (Table S2). Despite the lack of exome-wide significant findings, we conducted an exploratory prioritization by identifying top-ranked candidate genes based on their P-values. A total of 14 genes, including ERN1, TANGO6, NEK4, and HOXC13, were identified as suggestive candidates, consistently appearing in the top-tier rankings across all three tests. Notably, six of these genes remained within the top 10 most significant results across the Burden, SKAT, and SKAT-O tests, implying a robust rare-variant signal even though it remained sub-threshold. These results highlight the inherent limitations of standard RVATs for complex metabolic traits such as T2D. The absence of genome-wide significant signals in these models likely stems from reduced statistical power due to neutral variants within a locus or to genetic architecture jointly influenced by common and rare alleles. This power deficiency underscores the necessity for an integrated analytical framework capable of modeling the synergistic effects of variants across the entire frequency spectrum.
Integrated Analysis of Common and Rare Variants via SKAT-RC methods
The primary objective of this study was to evaluate the joint contribution of rare and common variants to T2D susceptibility using the SKAT-RC framework. Table 3 summarizes the candidate genes prioritized by ranking within the top 10 P-values across the four SKAT-RC-based methodologies (Burden-C, Burden-A, SKAT-C, and SKAT-A). To enhance clarity and delineate the underlying genetic mechanisms, these prioritized findings were explicitly partitioned into established benchmark loci representing genetic continuity and novel discoveries uncovered via the joint architecture framework.
Integrated gene-based association results and prioritization of candidate loci using the SKAT-RC methods
Among the identified loci, two genes, KCNQ1 and CDKAL1, surpassed the FDR significance threshold (FDR-adjusted q-value < 0.05). These signals, primarily driven by common variants, were highly consistent with our previous single-variant association results, thereby validating the robustness of our analytical pipeline and confirming their roles as definitive susceptibility loci for T2D in the Korean population. Additionally, PAX4, a well-established gene critically involved in pancreatic beta-cell function and the pathogenesis of T2D, was successfully prioritized among the top-ranked candidates. The robust capture of these markers demonstrates the strong alignment and genetic continuity of our integrated framework with known, validated T2D risk factors.
While the relatively modest sample size of the integrated cohort may have limited the statistical power to detect large-scale signals that exceed stringent FDR thresholds across all loci, the SKAT-RC framework successfully prioritized several biologically compelling novel candidate genes. Specifically, robust association signals were identified in the MARCHF3, CHEK2, and HMGA1 loci-signals that were entirely missed or obscured by conventional single-variant analyses and RVATs.
The identification of these loci highlights the unique capacity of the SKAT-RC approach to unearth hidden signals by simultaneously modeling the joint architecture of common and rare variation at a single locus. These genes have been previously implicated in metabolic and T2D-related pathways in prior functional studies, and their distinct biological roles and etiologies are addressed in detail in the Discussion.
In conclusion, these findings demonstrate that the SKAT-RC approach, by simultaneously modelling both common and rare variation, provides a more comprehensive view of the genetic landscape than conventional methods. This integrated framework not only replicates known risk factors but also effectively identifies promising candidate genes that are otherwise obscured in frequency-stratified analyses.
Discussion
In this study, we conducted a comprehensive genetic association analysis for T2D in a large-scale Korean population (N = 11,506) by integrating data from three KoGES cohorts. While previous GWAS have identified numerous risk loci, a significant portion of T2D heritability remains unexplained, particularly regarding the contribution of rare functional variants. By applying the SKAT-RC framework to Exome Chip data, we demonstrated that the joint analysis of common and rare variants substantially enhances statistical power compared to frequency-stratified approaches. Our strategy successfully replicated hallmark loci such as CDKAL1 and KCNQ1, while identifying novel candidate genes—including HMGA1, MARCHF3, and CHEK2—that were bypassed by traditional single-variant or rare-variant-only methods.
The identification of HMGA1 (High Mobility Group AT-Hook 1) as a susceptibility locus is particularly significant. HMGA1 is a non-histone chromatin-binding protein that regulates insulin receptor (INSR) gene expression [23]. While rare variants such as rs146052672 have been linked to severe insulin resistance in European populations, our findings extend this genetic association to East Asians [24]. Notably, the association at the HMGA1 locus was uniquely captured by SKAT-RC, suggesting that its genetic architecture in Koreans involves a synergistic interplay between common regulatory signals and rare coding variations. This underscores the capacity of integrated models to recover "hidden" signals within established metabolic pathways.
We also identified MARCHF3 and CHEK2 as promising susceptibility loci. MARCHF3 encodes an E3 ubiquitin ligase involved in membrane receptor trafficking. Given the critical role of the ubiquitin-proteasome system in maintaining pancreatic β-cell integrity and insulin signaling [25-27], dysregulation of MARCHF3 may impair the stability of surface proteins such as GLUT4. Similarly, CHEK2, primarily known as a tumor suppressor, has recently been implicated in insulin secretion by modulating DNA repair pathways in β-cells [28]. The fact that these signals were detected exclusively through the SKAT-RC framework highlights its superior sensitivity to loci where risk is distributed across the entire frequency spectrum.
From a methodological perspective, our results highlight the utility of addressing the limitations of the traditional dichotomization of genetic variants based on arbitrary frequency thresholds (e.g., MAF = 0.01). While conventional frequency-stratified strategies remain indispensable for pinpointing risk alleles strictly confined to a single frequency domain, they may fail to detect loci where common and rare variants exert joint, cumulative effects. By applying SKAT-RC, we demonstrated that modelling variants as a continuum provides a valuable statistical approach for recovering these integrated signals. Crucially, this approach should be conceptualized as a complementary framework that operates alongside standard single-variant GWAS and dedicated RVATs, rather than as a universal replacement, since each methodology has distinct strengths for characterizing specific genetic architectures.
Our study possesses several notable strengths that reinforce the validity of our findings. Primarily, by leveraging the large-scale KoGES cohort, we effectively minimized the confounding effects of population stratification, thereby maximizing our capacity to detect genetic variants unique to the Korean population. Furthermore, the use of Exome-chip data allowed us to prioritize functional coding variants, which inherently offer more direct biological insights than the intergenic tag SNPs typically analyzed in standard GWAS. These data were further empowered by the application of the SKAT-RC methods; this methodological innovation provided a robust, complementary statistical approach that successfully captured complex joint genetic architectures often missed by conventional pipelines.
Despite these contributions, several limitations warrant consideration. Although we identified statistical associations for HMGA1, MARCHF3, and CHEK2, the lack of in vitro or in vivo functional validation means that the precise molecular mechanisms of these variants remain to be fully elucidated. Additionally, while the focus on a homogeneous Korean population reduced genetic noise, it also limits the immediate generalizability of our results to other ethnic groups, necessitating future replication in diverse populations to confirm global relevance. Finally, although we adjusted for major covariates, including age, BMI, and lifestyle factors, we cannot entirely rule out residual confounding from unmeasured environmental variables, such as detailed dietary patterns or gut microbiome composition.
Conclusion
In conclusion, this study underscores the critical importance of integrating the effects of common and rare variants to fully elucidate the complex genetic architecture of T2D. By leveraging the SKAT-RC framework on large-scale KoGES exome-chip data, we demonstrated how this approach effectively complements conventional single-variant GWAS and standard rare-variant association tests. Rather than serving as a replacement for traditional frequency-stratified methods, this integrated continuum-based model acts as a powerful analytical expansion, leading to the identification of novel candidate loci, including HMGA1, MARCHF3, and CHEK2, which had previously remained undetected. Our findings not only validate the unique genetic landscape of the Korean population but also demonstrate that a significant portion of the "missing heritability" can be recovered by advanced statistical models that encompass the full allelic spectrum. Ultimately, this work provides a robust analytical foundation to enhance the precision of risk prediction and paves the way for personalized medicine strategies tailored to East Asian populations.
Funding
This work was supported by the National Research Foundation of Korea (NRF) grant funded by the Korea government (MSIT) (RS-2026-25483645).
Supplementary Materials
Supplementary materials related to this article can be found online at http://kj-ph.snu.ac.kr/
Ethics approval
The study was conducted in accordance with the Declaration of Helsinki and approved by the Institutional Review Board of Hanyang University (protocol code HYUIRB-202606-004).
Data Availability Statement
This study was provided with biomedical and research resource, containing genetic and health information from CODA (Clinical & Omics Data Archive), the Agency for Disease Control and Prevention, Republic of Korea (CODA_S2600001-01).
Conflicts of Interest
The authors declare no conflicts of interest.
References
-
Mlynarska E, Czarnik W, Dzieza N, Jedraszak W, Majchrowicz G, Prusinowski F, Stabrawa M, Rysz J, Franczyk B: Type 2 Diabetes Mellitus: New Pathogenetic Mechanisms, Treatment and the Most Important Complications. Int J Mol Sci 2025, 26(3).
[https://doi.org/10.3390/ijms26031094]

-
Roglic G: Global report on diabetes: World Health Organization; 2016.
[https://doi.org/10.4103/2468-8827.184853]
-
Bae JH, Han KD, Ko SH, Yang YS, Choi JH, Choi KM, Kwon HS, Won KC: Diabetes Fact Sheet in Korea 2021. Diabetes Metab J 2022, 46(3):417–426.
[https://doi.org/10.4093/dmj.2022.0106]
-
Fowler MJ: Microvascular and macrovascular complications of diabetes. Clin diabetes 2008, 26(2):77–82.
[https://doi.org/10.2337/diaclin.26.2.77]
- Spracklen CN, Horikoshi M, Kim YJ, Lin K, Bragg F, Moon S, Suzuki K, Tam CHT, Tabara Y, Kwak SH et al: Identification of type 2 diabetes loci in 433,540 East Asian individuals. Nature 2020, 582(7811):240–245.
- Scott RA, Scott LJ, Maegi R, Marullo L, Gaulton KJ, Kaakinen M, Pervjakova N, Pers TH, Johnson AD, Eicher JD et al: An Expanded Genome-Wide Association Study of Type 2 Diabetes in Europeans. Diabetes 2017, 66(11):2888–2902.
-
Rees SD, Bellary S, Britten AC, O'Hare JP, Kumar S, Barnett AH, Kelly MA: Common variants of the TCF7L2 gene are associated with increased risk of type 2 diabetes mellitus in a UK-resident South Asian population. BMC Med Genet 2008, 9:8.
[https://doi.org/10.1186/1471-2350-9-8]
-
Plengvidhya N, Chanprasert C, Chongjaroen N, Yenchitsomanus PT, Homsanit M, Tangjittipokin W: Impact of KCNQ1, CDKN2A/2B, CDKAL1, HHEX, MTNR1B, SLC30A8, TCF7L2, and UBE2E2 on risk of developing type 2 diabetes in Thai population. BMC Med Genet 2018, 19(1):93.
[https://doi.org/10.1186/s12881-018-0614-9]
-
Manolio TA, Collins FS, Cox NJ, Goldstein DB, Hindorff LA, Hunter DJ, McCarthy MI, Ramos EM, Cardon LR, Chakravarti A et al: Finding the missing heritability of complex diseases. Nature 2009, 461(7265):747–753.
[https://doi.org/10.1038/nature08494]
-
Cirulli ET, Goldstein DB: Uncovering the roles of rare variants in common disease through whole-genome sequencing. Nat Rev Genet 2010, 11(6):415–425.
[https://doi.org/10.1038/nrg2779]
-
Wu MC, Lee S, Cai T, Li Y, Boehnke M, Lin X: Rare-variant association testing for sequencing data with the sequence kernel association test. Am J Hum Genet 2011, 89(1):82–93.
[https://doi.org/10.1016/j.ajhg.2011.05.029]
-
Lee S, Wu MC, Lin X: Optimal tests for rare variant effects in sequencing association studies. Biostatistics 2012, 13(4):762–775.
[https://doi.org/10.1093/biostatistics/kxs014]
-
Ionita-Laza I, Lee S, Makarov V, Buxbaum JD, Lin X: Sequence kernel association tests for the combined effect of rare and common variants. Am J Hum Genet 2013, 92(6):841–853.
[https://doi.org/10.1016/j.ajhg.2013.04.015]
-
Madsen BE, Browning SR: A groupwise association test for rare mutations using a weighted sum statistic. PLoS Genet 2009, 5(2):e1000384.
[https://doi.org/10.1371/journal.pgen.1000384]
-
Bodmer W, Bonilla C: Common and rare variants in multifactorial susceptibility to common diseases. Nat Genet 2008, 40(6):695–701.
[https://doi.org/10.1038/ng.f.136]
-
Cardin NJ, Mefford JA, Witte JS: Joint association testing of common and rare genetic variants using hierarchical modeling. Genet Epidemiol 2012, 36(6):642–651.
[https://doi.org/10.1002/gepi.21659]
-
Lee HS, Kim Y, Park T: New Common and Rare Variants Influencing Metabolic Syndrome and Its Individual Components in a Korean Population. Sci Rep 2018, 8(1):5701.
[https://doi.org/10.1038/s41598-018-23074-2]
-
Kim Y, Han BG, Ko GESg: Cohort Profile: The Korean Genome and Epidemiology Study (KoGES) Consortium. Int J Epidemiol 2017, 46(2):e20.
[https://doi.org/10.1093/ije/dyv316]
-
Friedewald WT, Levy RI, Fredrickson DS: Estimation of the concentration of low-density lipoprotein cholesterol in plasma, without use of the preparative ultracentrifuge. Clin Chem 1972, 18(6):499–502.
[https://doi.org/10.1093/clinchem/18.6.499]
-
American Diabetes A: 2. Classification and Diagnosis of Diabetes: Standards of Medical Care in Diabetes-2021. Diabetes Care 2021, 44(Suppl 1):S15–S33.
[https://doi.org/10.2337/dc21-S002]
-
Kim YK, Hwang MY, Kim YJ, Moon S, Han S, Kim BJ: Evaluation of pleiotropic effects among common genetic loci identified for cardio-metabolic traits in a Korean population. Cardiovasc Diabetol 2016, 15:20.
[https://doi.org/10.1186/s12933-016-0337-1]
-
Purcell S, Neale B, Todd-Brown K, Thomas L, Ferreira MA, Bender D, Maller J, Sklar P, de Bakker PI, Daly MJ et al: PLINK: a tool set for whole-genome association and population-based linkage analyses. Am J Hum Genet 2007, 81(3):559–575.
[https://doi.org/10.1086/519795]
-
Chiefari E, Tanyolac S, Paonessa F, Pullinger CR, Capula C, Iiritano S, Mazza T, Forlin M, Fusco A, Durlach V et al: Functional variants of the HMGA1 gene and type 2 diabetes mellitus. JAMA 2011, 305(9):903–912.
[https://doi.org/10.1001/jama.2011.207]
-
Bianco A, Chiefari E, Nobile CG, Foti D, Pavia M, Brunetti A: The Association between HMGA1 rs146052672 Variant and Type 2 Diabetes: A Transethnic Meta-Analysis. PLoS One 2015, 10(8):e0136077.
[https://doi.org/10.1371/journal.pone.0136077]
-
Wang X, Jiang L, Liu XQ, Huang YB, Zhu W, Zeng HX, Gao L, Ma LJ, Zhang MY, Zhu QJ et al: Identification of Genes Reveals the Mechanism of Cell Ferroptosis in Diabetic Nephropathy. Front Physiol 2022, 13:890566.
[https://doi.org/10.3389/fphys.2022.890566]
-
Nathan JA, Lehner PJ: The trafficking and regulation of membrane receptors by the RING-CH ubiquitin E3 ligases. Exp Cell Res 2009, 315(9):1593–1600.
[https://doi.org/10.1016/j.yexcr.2008.10.026]
-
Yang XD, Xiang DX, Yang YY: Role of E3 ubiquitin ligases in insulin resistance. Diabetes Obes Metab 2016, 18(8):747–754.
[https://doi.org/10.1111/dom.12677]
-
Chong ACN, Vandana JJ, Jeng G, Li G, Meng Z, Duan X, Zhang T, Qiu Y, Duran-Struuck R, Coker K et al: Checkpoint kinase 2 controls insulin secretion and glucose homeostasis. Nat Chem Biol 2024, 20(5):566–576
[https://doi.org/10.1038/s41589-023-01466-4]